Annual Operating and Capital Budget
The annual budget is prepared on a program basis. Detailed annual work plans for operation and maintenance activities are developed during the budget process each year. These work plans itemize the cost of activities and projects within each section, or function of the water or wastewater systems. The total FY2012 budget for the Water Fund (7020) was $100,321,458 and Sewer Fund (7030) was $90,138,701. These figures include personal services, materials and supplies, other services, transfer to general fund, indirect costs, capital equipment, transfer to capital projects, and debt service. The following charts show a breakdown of the FY2012 operating budgets for both the Water and Sewer funds by the type of expenditure.
More detailed figures are included in the Statistical Section of this report, as well as the FY2012 Comprehensive Financial Report.
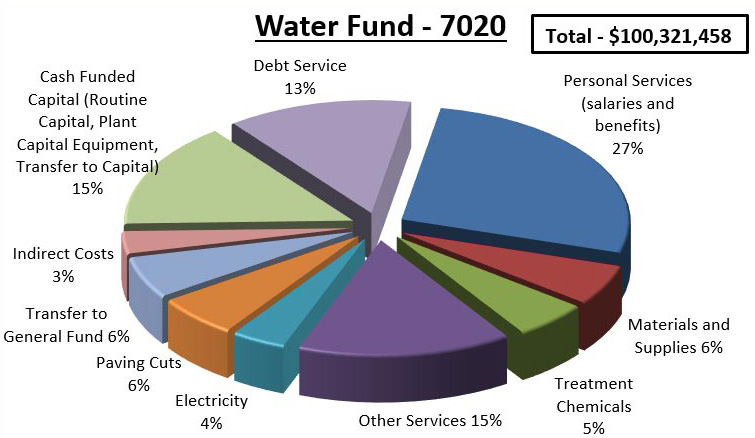
Chart 1.
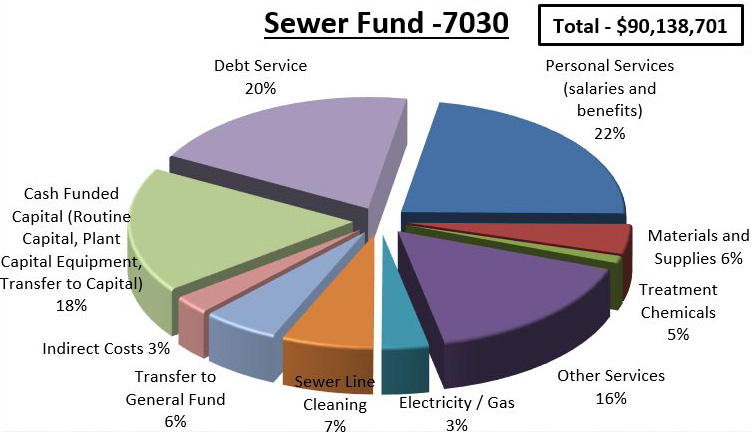
Chart 2.
Staffing
The Water Fund and Sewer Fund collectively employ 891.3 full time equivalent employees (FTE). The Water Fund employs 481.8 FTE’s and the Sewer Fund 409.5 FTE’s. At full staff there are 642 authorized positions in the Water and Sewer Department. The following charts illustrate the breakdown of direct charge staffing and support, or shared services for the Water Fund and Sewer Fund.
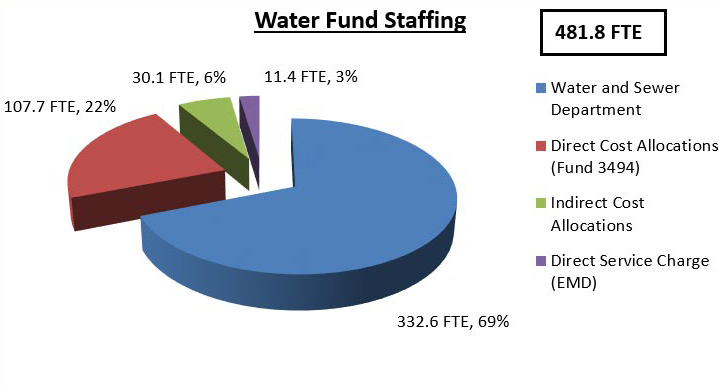
Chart 3.
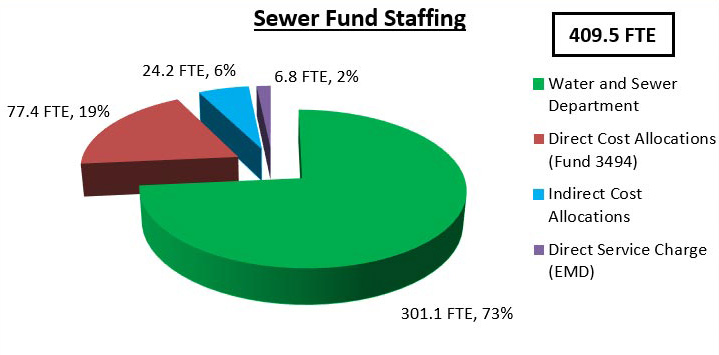
Chart 4.
Revenues and Rate Setting
Tulsa’s water and sewer rates are set based on cost-of-service analysis. Cost-of-service analyses are conducted on an annual basis as part of the budgeting process. The key objectives of the cost-of-service analyses are to forecast annual water and sewer revenue requirements to fund projected operating and capital expenditures, allocate costs on an equitable basis to each customer class, comply with debt service coverage requirements, and maintain adequate financial reserves.
TMUA, over the past few years, has adjusted rates to accommodate the rising costs of water and sewerage services and maintaining our aging infrastructure. In May 2011, TMUA voted to increase water rates 7 percent for all customers, effective October 1, 2011. Sewer rates were adjusted 9 percent for all customers, effective October 1, 2011. The rate increases were confirmed by the Mayor and City Council in June 2011.
Water Revenues
Revenue generated by the FY2012 adopted 7 percent rate increase along with increased revenues due to the excessive heat and drought conditions experienced in the summer 2011 generated about $12.3 million over FY2011 actual billed revenues and $9.9 million over FY2012 budget estimates. Of that $3.8 million went to additional debt service and capital equipment in FY2013. The remainder allowed TMUA to transfer to major capital projects $12.550 million in FY2013, an increase of $8.2 million over FY2012. In FY2012 TMUA deferred $22.1 million in revenue bonds in an effort to control debt. In FY2012, revenues exceeded outlays by $6.555 million. The year-end balance, after reserving for the 5 percent cash operating reserve, is estimated to be $9.1 million.
The following chart shows the actual billed water revenues compared to budget for the period FY2002 through FY2012.
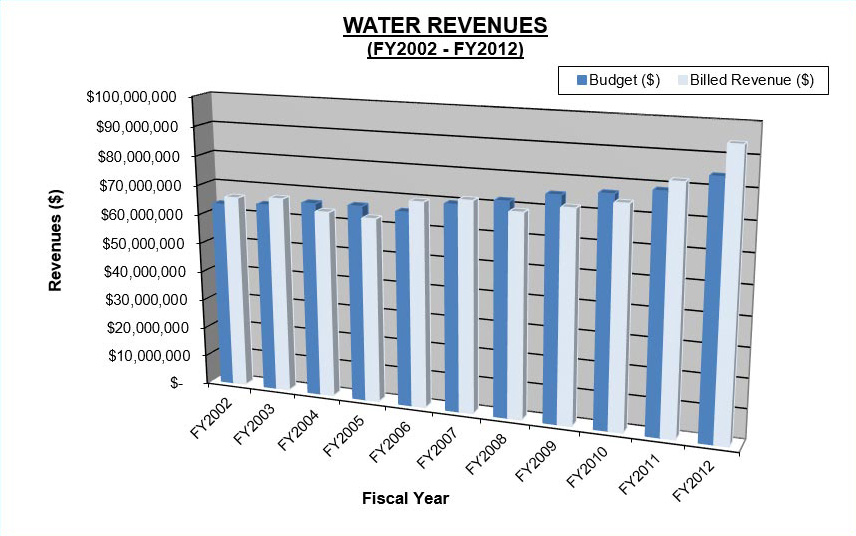
Chart 5.
Sewer Revenues
Revenue generated by the FY2012 adopted 9 percent rate increase generated about $5.3 million over FY2011 actual billed revenues and $1.0 million under FY2012 budget estimates. Of that $3.5 million went to additional debt service and capital equipment in FY2013. The remainder allowed TMUA to transfer to major capital projects $3.410 million in FY2013, only a slight increase over FY2012’s $2.341 million, but reducing the amount borrowed in the FY2013 capital program. In FY2012, outlays exceeded revenues by $3.6 million. The year-end balance, after reserving for the 5 percent cash operating reserve, is estimated to be $2.3 million.
The following chart shows the actual billed wastewater revenues compared to budget for the period FY2002 through FY2012.
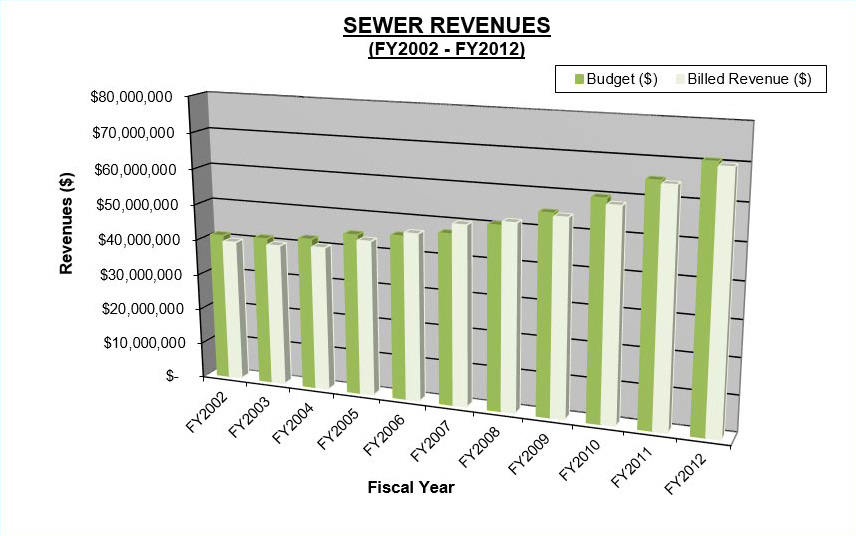
Chart 6.
Tables 1 and 2 on the following pages show Tulsa’s Top 15 water consumers by rank for the period FY 2003 through FY2012 by consumption (Table 1) and amount billed (Table 2). For the purpose of this table, both potable (treated) and raw water are included.
Water Consumption and Sewer Usage
Actual billed water consumption in FY2012 was 38.015 billion gallons. Actual billed sewerage was 14.742 billion gallons. The following charts illustrate the breakdown of water consumption for FY2012 – inside city versus outside city, and by customer type.
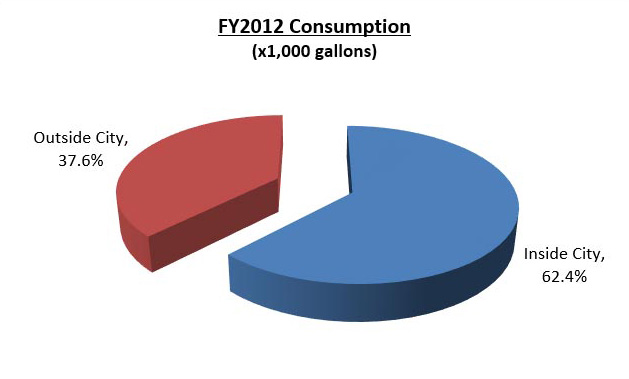
Chart 7.
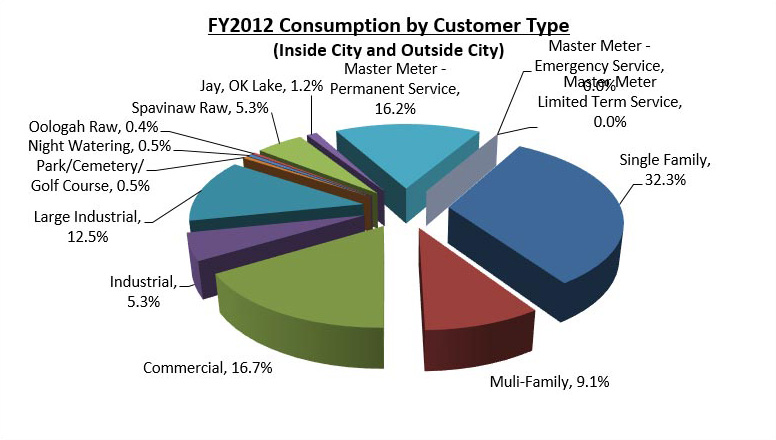
Chart 8.
Key Metrics
One key measurement introduced in the Comprehensive Assessment was “affordability”, or the ability of lower income households to pay continually increasing water and sewer rates. The Environmental Protection Agency (EPA) established affordability criteria for water and wastewater systems with the 1996 Amendments to the Safe Drinking Water Act. The four (4) percent benchmark is measured as the total annual water and sewer bill divided by the median household income for the service area. The four percent benchmark translates to two percent each for the individual water bill and individual sewer bill. These figures however are considered to be a worst case scenario. The water and wastewater industries have long considered an acceptable affordability ratio for a combined bill to be within a range of 1.5 to 2.5 percent.
Table 3 shows a summary of the average consumption or usage for single–family residential TMUA customers, and the “affordability” ratio for the period FY2005 through FY2011. The median household income was obtained from the American Community Survey conducted by the U.S. Census Bureau. Tulsa’s affordability ratios for FY2011 are 0.79 percent and 0.64 percent for water and sewer, respectively. The combined ratio is 1.43 percent, below both standards discussed above. Table 4 shows Tulsa compared to other peer cities identified in the Comprehensive Assessment.
Tulsa’s peer cities pay on average 14 percent more in water and sewer rates than Tulsans do. In 2009 the same report showed Tulsa six (6) percent below the average of the seven peer cities surveyed. This statistic concludes that other cities are increasing rates at a faster pace than Tulsa. Tulsa continues to be below the average of cities in this region of the country for water and sewer rates.
(Rates effective June 1, 2012 – Austin, Dallas, Denver, Fort Worth, Kansas City, Little Rock, Oklahoma City and Wichita) 
Water CIP
Total budgeted expenditures for the FY2012 Capital Improvement Plan were $25.9 million for the water system – $4.350 million in cash from the rate base and $21.550 million in the issuance of revenue bonds. Through the CIP review process, it was determined that some projects were not ready to proceed in FY2012 and existing capital accounts were analyzed and found sufficient unexpended funds in completed projects to enable the re-appropriation of funds to other projects. Thus, revenue bonds were not issued in FY2012.
The total projected expenditures for the FY2012 – FY2016 Five-Year Water Capital Improvement Plan are $141.950 million. As of June 30, 2012, the Water Fund has outstanding debt of $157,756,938. A breakdown of the debt is shown in the following chart.
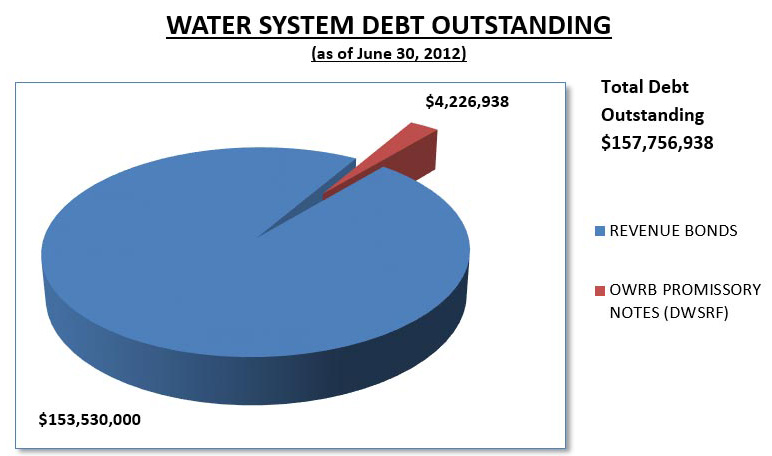
Chart 9.
Wastewater CIP
Total budgeted expenditures for the FY2012 Capital Improvement Plan were $37.588 million for the wastewater system – $2.341 million in cash from the rate base, $10.700 million in proceeds from the City’s Third Penny revenue collections, and $24.547 million in the loans from the Oklahoma Water Resources Board. Through the CIP review process, it was determined that some projects were not ready to proceed in FY2012 and existing capital accounts were analyzed and found sufficient unexpended funds in completed projects to enable the re-appropriation of funds to other projects. Thus, the borrowing of funds from OWRB was reduced to $14.947 million, a reduction of $9.600 million.
The total projected expenditures for the FY 2012 – FY 2016 Five-Year Wastewater Capital Improvement Plan are $174.328 million. As of June 30, 2012, the Wastewater Fund has outstanding debt of $191,191,022. A breakdown of the debt is shown in the following chart.
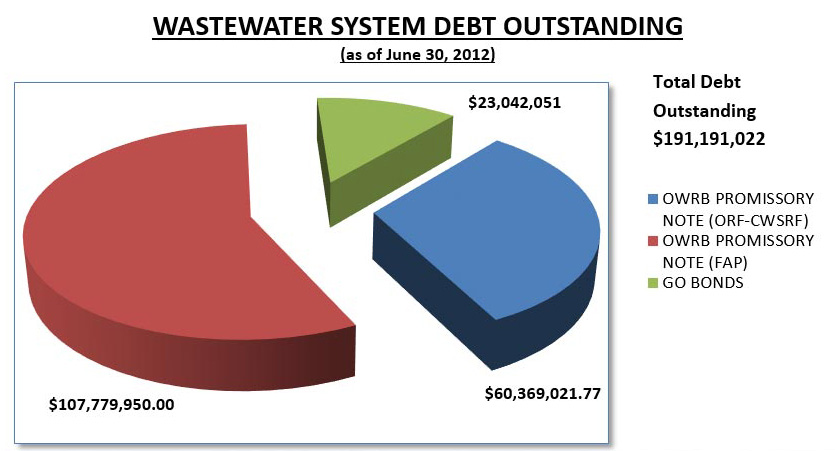
Chart 10.

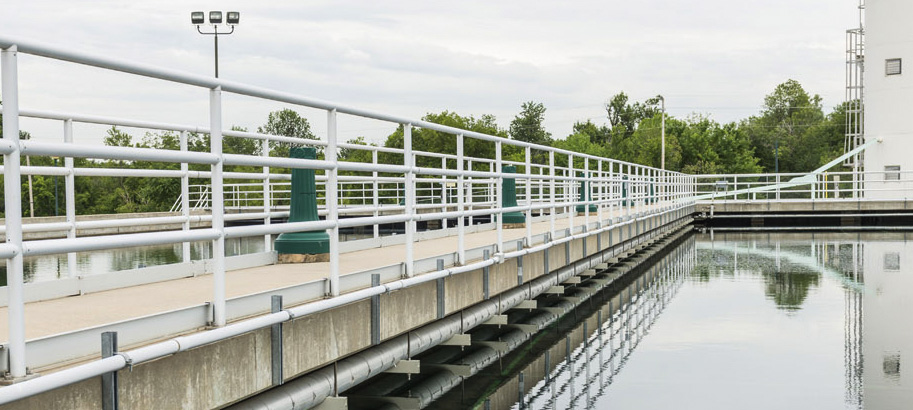
 The Water and Sewer Department provides high-quality drinking water and wastewater collection and disposal services, while planning for future growth, implementing sustainability measures, safe guarding public health and the environment, and continually seeking process improvements and cost efficiencies. The Department’s primary functions are water supply, treatment and distribution, as well as wastewater collection, treatment and disposal.
 Rather than focusing on just financial, operational, or capital, TMUA chose to take a holistic approach considering all significant aspects of the utility systems including governance and organizational structure, management, operational performance, capital needs, financial condition, and legal and public policy issues. The final report was received in August 2012. Following is an overview of the findings presented.